
营销电话:18904058930
400热线:400-024-4806

产品中心
我们的工厂具备完善的技术,精良的工艺,先进的设备,和一直以“质量,创新,负责”为理念的先进团队,产品在各界一直是有口皆碑
Gidvis-Energy
发布时间: 2020-10-28 14:51


摘要
Record and display energy data, reduce costs With rising energy costs, increasingly strict environmental regulations and high competition pressure, energy management is increasingly gaining in significance. Only when energy data is logged, displayed and evaluated is it possible to initiate measures for reducing energy consumption and enhancing efficiency, thereby also saving costs.
产品介绍
Record and display energy data, reduce costs
GridVis®-Energy is a web-based solution for your energy management, for the display of your energy data. With GridVis®-Energy you gain a qualified tool, which optimally satisfies the stricter requirements for increased transparency and flexibility in the operational utilisation of resources. Thanks to the comparison options for your energy data, you can use benchmarks to optimise your strategy and implement long-term and short-term aims. A server with pre-installed software is already provided in the scope of delivery for simple integration in your IT infrastructure.You obtain a complete solution!
In addition to standardised templates, widgets, websites, graphs, colours, icons, etc. are adapted to the corporate design of your company. If new widgets or sites are required at a later date, these can be created by Janitza and integrated without delay. An integrated website configurator can be used to edit dashboards using drag and drop. The intuitive operation allows you to create various graphs, tables, etc. and freely position these on so-called dashboards.
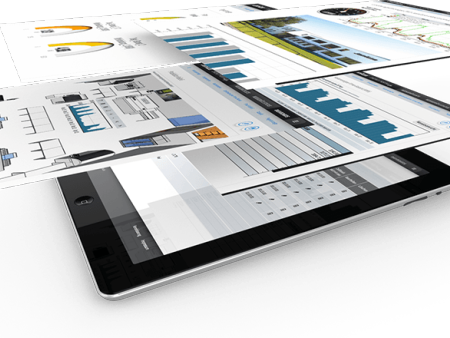
With GridVis®-Energy, the energy data can be called up from anywhere in the world via internet and/or intranet and can also be displayed directly in the browser on mobile devices such as the iPad. GridVis®-Energy provides you with a convenient complete solution without a great need for training.
Gridvis-Energy
Your energy distribution at a glance
Using your energy distribution you not only maintain an overview, you can also navigate to the respective measuring point directly by simply clicking on it
Energy template screen
The energy template screen contains a clear overview of your energy values, both historically and online. With the heat map (spectral analysis), the cost-driving peak loads are visible at a glance. The bar chart automatically compares the energy consumption in relation to a reference date, e.g. last month vs. the current month (further template pages include e.g. power, current and voltage).
Sankey diagram (optional)
The Sankey diagram is the most sophisticated method for energy interpretation and evaluating the energy profile across the entire company. With just one diagram it is possible to see how the energy distribution is configured within your company, what the largest electrical loads are and where the unlogged loads or the losses are arising. This allows you to define definitive optimisation targets and display the successes with the next audit.
Gridvis-Energy
Energy data any time and any place
Your secure, sustainable and efficient handling of electrical energy is our top priority. We therefore supply you with diverse modular products, ranging from the universal measuring device through to class A power quality analysers.The grid visualisation software GridVis® constitutes an elementary component.
Presenting your energy data on the internet and/or intranet not only enables users of your company network to access the information they require, this is also made accessible to authorised personnel in branches, partners, field sales employees and external service providers.
Gridvis-Energy
Visualisation of your energy data
Gridvis-EnergyGridvis-EnergyGridvis-Energy
Gridvis-Energy
Record and display energy data, reduce costs With rising energy costs, increasingly strict environmental regulations and high competition pressure, energy management is increasingly gaining in significance. Only when energy data is logged, displayed and evaluated is it possible to initiate measures for reducing energy consumption and enhancing efficiency, thereby also saving costs.
产品介绍
Record and display energy data, reduce costs
GridVis®-Energy is a web-based solution for your energy management, for the display of your energy data. With GridVis®-Energy you gain a qualified tool, which optimally satisfies the stricter requirements for increased transparency and flexibility in the operational utilisation of resources. Thanks to the comparison options for your energy data, you can use benchmarks to optimise your strategy and implement long-term and short-term aims. A server with pre-installed software is already provided in the scope of delivery for simple integration in your IT infrastructure.You obtain a complete solution!
In addition to standardised templates, widgets, websites, graphs, colours, icons, etc. are adapted to the corporate design of your company. If new widgets or sites are required at a later date, these can be created by Janitza and integrated without delay. An integrated website configurator can be used to edit dashboards using drag and drop. The intuitive operation allows you to create various graphs, tables, etc. and freely position these on so-called dashboards.
With GridVis®-Energy, the energy data can be called up from anywhere in the world via internet and/or intranet and can also be displayed directly in the browser on mobile devices such as the iPad. GridVis®-Energy provides you with a convenient complete solution without a great need for training.
Gridvis-Energy
Your energy distribution at a glance
Using your energy distribution you not only maintain an overview, you can also navigate to the respective measuring point directly by simply clicking on it
Energy template screen
The energy template screen contains a clear overview of your energy values, both historically and online. With the heat map (spectral analysis), the cost-driving peak loads are visible at a glance. The bar chart automatically compares the energy consumption in relation to a reference date, e.g. last month vs. the current month (further template pages include e.g. power, current and voltage).
Sankey diagram (optional)
The Sankey diagram is the most sophisticated method for energy interpretation and evaluating the energy profile across the entire company. With just one diagram it is possible to see how the energy distribution is configured within your company, what the largest electrical loads are and where the unlogged loads or the losses are arising. This allows you to define definitive optimisation targets and display the successes with the next audit.
Gridvis-Energy
Energy data any time and any place
Your secure, sustainable and efficient handling of electrical energy is our top priority. We therefore supply you with diverse modular products, ranging from the universal measuring device through to class A power quality analysers.The grid visualisation software GridVis® constitutes an elementary component.
Presenting your energy data on the internet and/or intranet not only enables users of your company network to access the information they require, this is also made accessible to authorised personnel in branches, partners, field sales employees and external service providers.
Gridvis-Energy
Visualisation of your energy data
Gridvis-EnergyGridvis-EnergyGridvis-Energy
Gridvis-Energy
品质源于尽心,服务铸就品牌
搜索
热门搜索:
名称描述内容
联系我们
地址:沈阳市和平区南京南街150号集智大厦1305室
电话:400-024-4806 18904058930
E-mail:liuxin@faithteq.com